


![[How To] Best Dedicated Server: Choose The Best Dedicated Server For Less](https://easypromocode.com/wp-content/uploads/2020/05/dedicated_server-2-100x65.jpg)

Most hosting control panel allows users to view hosting server status directly from the control panel interface. cPanel for example reveals the server status (server load, memory usage, etc.) via a link named ‘Service Status’. Besides tracking on website’s uptime, checking on service status is another good way to keep track on your hosting performance. It’s also a good way to stay alert and react promptly whenever your web host starts overselling.
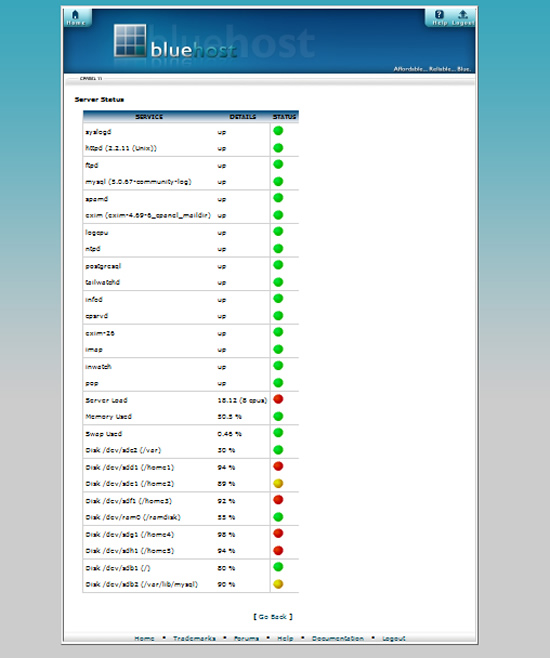
To view your website server status, simply login to your hosting cPanel (assuming that you’re hosting on Linux and using cPanel), scroll down a little and look for a small text link named ‘Service Status’ on your left, click in to view the details.
What do the numbers in server status mean?
The server service level are normally indicated in numbers and images – green light for good, yellow light for moderate, and red light for bad.
However, it’s good to know what do some of these numbers mean. In brief:
- exim refers to the mailserver service status
- mysql refers to the database status
- eximstats refers to the mail stats reporting service status
- cpanellogd refers to the cpanel log/stats reporting service status
- httpd refers to the webserver service status
- pop up refers to the mail service status
- named refers to the DNS service status
- ftpd refers to the FTP server service status
- Server Load #.## (# cpus) refers to (well), the server load. Basically the first number is the number of processes currently in queue; while the number of cpu’s (in bracket) is the CPU capacity. Everything’s being processed without delay when the first number is smaller than the second.
- Memory Used ## % reveals how much memory (RAM) is used. The lower the percentage, the less is your server working (which is good). Overselling host will normally surfer in this section as there are more than enough server resources to be used.
- Swap Used ## % refers to the usage of secondary (virtual) memory. It’s like the backup brains for the server.
- Disk /dev/sda6 (/tmp) ## % refers to hard drive usage for temporary files (cache for example).
- Disk /dev/sda7 (/home) ## % refers to hard drive usage for main file storage
- Disk /dev/sda1 (/) ## % refers to hard drive usage for central file directories.
- Disk /dev/sda2 (/var) ## % refers to hard drive usage for systems.
- Disk /dev/sda3 (/usr) ## % refers to hard drive usage for systems.
Well then, I hope you have better understanding with your web server status by now.